Literacy Beat goes to IRA (Friday)

Most of the Literacy Beat Team will be in New Orleans at the International Reading Association (IRA) this weekend. We have created a series of short posts with links to online resources about our activities there. Each day of the conference, you will find our content shared here for you.

On Friday, Jill and DeVere will be at the Writing Moments Institute organized by Kathy Ganske.

Jill presented on the topic: Using Reading, Talking, Writing, and Digital Tools to Understand Disciplinary Texts in the Middle Grades

This session showed teachers ways to structure evidence-based discussions that draw upon both text and experience to aid students in developing academic language, writing proficiency, and content-area learning.  Participants took part in informational text reading and evidence based discussions that serve as preparation for writing an argument. Ways to use digital tools to support writing and thinking were highlighted and demonstrated.  Workshop materials, include the PPT and all activities can be accessed from the workshop’s Google Site.

DeVere addressed: Writing from Sources in the Disciplines: Tips for Engagement and Digital Tools, Too  

How many sources do we need? Teachers hear this question all the time, and it is really a tough one, not as easy as it sounds. Writing from and with sources means students must often consult a wide variety of sources, use some, discard others, and make sure the sources they do use are appropriate and relevant. The task is not as easy as it sounds; then add to that the complexity (cf. Spiro, et al., 2004) of the topics students encounter in middle and high school, and an arbitrary number of sources suddenly seems to impose limits on student exploration, not a door to further exploration (Wolsey, 2010; Wolsey, Lapp, & Fisher, 2012). In this session, participants learned how to construct a prompt or direction for writing (e.g., Hillocks, 1986) that engages student-scholars, teach students to use solid argumentation approaches (cf. Toulmin, 2003, Walton, Reed, & Macagno, 2008) in the disciplines, promote inquiry through composing processes in content areas, and use digital tools.

View the PowerPoint on Slideshare:

Picture Book Abundance: Will It Ever Happen?

A guest post by Mark Condon

Can you envision book abundance, worldwide?

Given the importance of good picture books to beginning readers, the goal of establishing picture book “abundance” is one that everyone can endorse. Supporting it as a cause and making it happen, however, are two very different things. Do the math. There are over 7 billion people in the world. Perhaps 10% of those people are birth to age 8, the ages for which picture books tend to be most important. That’s 700 million children. Now, many of those have plenty of picture books, but more of them do not.

However, for the sake of conversation let’s say 350 million children who need access to abundant picture books don’t have it.

So, how many picture books qualify as “abundant” enough to support each of those kids in learning even basic reading ability? A convenient and defensible number is 100. That comes from Evans and colleagues(2010) who discuss what they call “family scholarly culture” a terrific concept that describes families that read and discuss books together. In their longitudinal study of 27 countries with data covering 20 years, Evans et al display graphics indicating that almost regardless of parent education or income, the number of books in the home is the best predictor of school success, and each book added to the home, up to just about 100 seems to increase that prospect of academic advancement. So, 100 books is certainly abundant enough.

So let’s see, 350,000,000 kids x 100 books, that’s 35 billion books needed. Oh, and that number increases each year with the addition of another 4 million or so new children added to the world’s population. Sadly, the Bill and Melinda Gates Foundation doesn’t have enough money to make even a small dent in that, even if they could get books (written, edited, printed, bound, stored, and transported) at a cost of $1 apiece, they then have to get the books into those children’s homes.

So, let’s face facts, book abundance – 100 books for every child in the world – will never happen… WAIT!…or will it?

The Digital Solution

The alternative solution to the one I posed above of course is digital books. By leveraging the rapidly expanding digital network system around the world and then populating a library with 100+ creative-commons copyrighted, mostly non-fiction (the intention being to create generally universally interesting content) picture books and then translating and narrating those books in nearly 7000 languages (I know, I know, but stay with me), it could work.

Look at the Global Book Publication Matrix, below.

Global Publishing Matrix

Global Publishing Matrix

Digital books can be created that are offered as a Global Public Good, i.e., A resource that is free for all (no login) and inexhaustible (digital).  That’s the goal of Unite for Literacy, a small “social enterprise” company in Colorado that has a free library that went online in August 2013.


Unite for Literacy to date actually has more than 100 books available in a free online library (www.UniteforLiteracy.com) and each one offers English text and is narrated in up to 18 world and indigenous languages. With the current languages, nearly half the families around the world can access the library and read the English book, listen to the English narration and/or listen to a book narration by a fluent native speaker of their home languages.

Plans include adding books created in collaboration with the content experts at local cultural institutions (museums, galleries, performance groups, sports teams, etc.) and of course adding more languages. Japanese was just added, Turkish and Slovak are on the way and Navajo and Cherokee are in the works. Also, when time and budget permit the books will be readable in the all of the world’s languages of instruction (about 200 by our count) as well.

Unite for Literacy is supported by generous corporate and organizational sponsors, all committed to world literacy and actively advocating for literacy in their communities. It is further being promoted by a growing number of educators, librarians and advocacy groups that take the online library link out to the communities that they serve. Sponsors are publicly recognized in the communities that they serve and on the companies’ websites, as well as in the library. Sponsorships are available for providing existing books for new language communities, for underwriting book authors to create new titles or to advocate for particular books with which they wish to be associated. Community literacy advocates take advantage of additional web resources to promote family readership and the accessing of books at home and school.

Digital Book Readers

Digital Books from Unite for Literacy

Free, digital, narrated, picture books are the game changer. There are efforts well under way as this is written that seek to create inexpensive smartphones and free or nominally priced mobile Internet access around the world. Those efforts, backed by the titans of digital communication, will in a very few years put the riches of the Internet within reach of even those living in poverty. When these digital books become eventually available in all 200+ world languages of instruction and those texts are accompanied by on-demand narrations in the almost 7000 indigenous and immigrant mother tongue languages found in homes that send their children to those instructional settings, then in fact worldwide picture book abundance will be a reality.

Unite for Literacy is working to make a contribution to that effort.

Reference:

Evans, M., Kelley, J., Sikorac, J., & Treimand, D. (2010). Family scholarly culture and educational success: Books and schooling in 27 nations.  Research in Social Stratification and Mobility, 28, pp. 171–197.

All images in this post courtesy of Unite for Literacy.

Project Planning, the Common Core, and Technology, Too

by Thomas DeVere Wolsey

Digital Project Management Tools bring College and Career Skills Right into the Classroom

This weekend, one of my projects is to renovate the garden and put in spring vegetables. It’s up to me and my favorite nursery. All I have to do is motor on down to the garden center, buy what I need, and plant the seeds and seedlings. Other projects take a bit more planning, and digital tools can be a big help. Students often have a great number of projects in progress, and many of those involve collaborative work. Students work with students, with their parents, and sometimes members of the community. Teachers orchestrate much of the project management aspects, quite often. But, what if students could take on some of the College and Career Readiness Standards and learn how to manage their own projects?

Here are some of the College and Career Readiness Anchor Standards that require collaboration.

CCSS.ELA-Literacy.CCRA.SL.1 Prepare for and participate effectively in a range of conversations and collaborations with diverse partners, building on others’ ideas and expressing their own clearly and persuasively.

CCSS.ELA-Literacy.CCRA.SL.6 Adapt speech to a variety of contexts and communicative tasks, demonstrating command of formal English when indicated or appropriate.

The Common Core State Standards in English-language arts/literacy emphasize the need, for the first time, for students to work together in a variety of settings and contexts and to use their literacy skills to get the job done. Assigning, selecting, or choosing a project is the first step. Managing the project so that work that is planned is actually carried out is where technology comes into play. Class projects last from a day to several weeks, and they range from preparing presentations to the class, making a digital demonstration of knowledge, or engaging in various service-oriented activities.

A project management tool that has been around for more than a century is named after the man who created it, Henry Gantt (cf. Clark, 1923). The Gantt chart has been used in the military, in manufacturing industries, live sports events (think Final Four) and in long range planning just about everywhere—including schools. Gantt charts are useful because they graphically show, “Work planned and work done are shown in the same space in relation to each other and in their relation to time” (p. v). Their visual nature encourages student project participants to develop a plan, stick to it, and note their progress over time. Digital tools improve Gantt charts by automating some tasks, making them easily available to project participants at any time, and being infinitely expandable. The use of color further improves the appeal and utility of the organizer.

Gantt project management organizers can be created with sticky notes on a white board or wall (Click here to see one example), on butcher paper, or with an 11 X 17 piece of construction paper. However, technology can greatly simplify the task. Typically, they show the tasks to be accomplished, who is responsible for each task, and a timeline showing planned and completed tasks. Excel® spreadsheets offer one digital solution to the Gantt chart that makes updating simple, and you’ll see that data entered in one part of the chart is translated visually.  Gantt charts can easily be created in a shared spreadsheet file such as those found in Google Docs, or with online apps specifically designed for this purpose (see figure 1), such as Smartsheet.

Smartsheet

Figure 1: Image courtesy of Smartsheet.

Online apps, such as Smartsheet, make it easy to share the chart on a class webpage, blog, or course management system. Parents can see it, students can edit and change it, and everyone will know who has to do what in order to get the job done and done well. Read more about project management tools for the classroom in this interview with Jodi Sorensen of Smartsheet. The company provides a free student project sheet for teachers to get started–log in and play around; it’s fun. There’s also a free teacher syllabus sheet. All those binders of curricular materials may be a thing of the past. One feature of Smartsheet I liked is the capability of linking other files (pictures, documents, and so on) right to the project organizer. See how this is done in this video on YouTube starting at time 0.36.

If you choose to use Excel or other spreadsheet software, you might find that templates for Gantt project management organizers are helpful because the setup is already done. In figure 2 you can see a basic template from Microsoft downloads, found here. Figure 3 shows a modified Gantt Project Management Organizer using Excel for use in upper-elementary and secondary grade classrooms, and you may download this template if you want to try it out.

Excel Gantt Chart

Figure 2: Generic Excel Gantt chart

Excel for School

Figure 3: An Excel Gantt chart modified for school projects.

Both of these organizers allow students to quickly enter data about what they plan to do, how much they have accomplished, and how they are proceeding. The neat thing is that Excel and other spreadsheets or software automatically create the timeline showing what is planned, and what is actually accomplished. These examples show a start date for the first of the month, but teachers can create their own templates just by deleting columns for dates that don’t match the timelines for completion.

Choose the digital tool you plan to use (e.g., Smartsheet, Excel). Next, train a few students, perhaps one from each project group or team, to be the expert on using the project management technology. The teacher should not be the only resource for using the tool.

Help students define the major parts of the task. In the example in figures 1 and 3- above, the teacher defined large categories as

1. Planning, Reading and research,, making it happen, etc.

or

2. Research, interviewing, and so on.

At first, students will need help breaking down the specific tasks for each category. A model the teacher creates or from past student project will be helpful in guiding students to decide just what the specific tasks might be.

Start the project!

In schools and at the university, we often engage students in projects of all kinds. However, students need to know more than what the project is and what its goals or objectives are. They also need the 21st century skills to manage large projects that will help them succeed in their schooling and in their careers.  Have you tried using digital project management tools, or even a traditional paper-based Gantt chart? If so, tell us about it by posting a comment.

Reference:

Clark, W. (1922) The Gantt chart: A working tool of management. New York, NY:  Ronald Press. Retrieved from https://archive.org/details/ganttchartworkin00claruoft

Read more on this topic at the International Reading Association website. (added 3-29-2014)

Pecha Kucha, a Presentation Format with Many Possibilities

By guest posters W. Ian O’Byrne & Sue Ringler Pet, & regular blogger Thomas DeVere Wolsey

The nature of literacy is rapidly evolving and these changes demand an expanded view of “text” to include visual, digital and other multimodal formats (Rose & Meyer, 2002; New London Group, 2000; Alvermann, 2002). A richer and more complex definition of literacy requires a complex theoretical framing of the “multiple realities” that exist between educational research and practice (Labbo & Reinking, 1999).  Several colleagues* decided to experiment with the pecha kucha presentation style at a session of the Literacy Research Association, December 5th, 2013. What they learned from the session and their ideas for PK-12 classrooms and teacher preparation coursework is summarized in this post of Literacy Beat. Our pecha kucha session used multiple methods united by similar perspectives to investigate shifts in the space and stuff (Lankshear & Knobel, 2006) of learning.

Evolving pedagogical models for new literacies and emerging technologies hold “explosive possibilities” (Barab & Kirshner, 2001) for reading and writing spaces. Specifically, these studies examine literacies as cutting across chronotopes of time and space (Bakhtin, 1937) and evolving into “communities of inquiry” in which participants require new knowledge and identities (Gee, 2005).

Since the technological advances documented in these studies drove much of the change that we see in information and communication, researchers and educators attempted to answer the important question:  How can the use of new and digital literacies in instruction enable “explosive possibilities” for meaning-making and identity construction? These studies examined literacies and digital texts while documenting perceived changes in social practice through the lens of teachers and students as agents of change.

What is Pecha Kucha?

Pecha kucha, Japanese for the sound of conversation, is a presentation method in which 20 slides are shown for 20 seconds each (6 minutes and 40 seconds in total). The format utilizes images more than words, keeps presentations concise and fast-paced, powers multiple-speaker events, keeps the interest level up, and gives more people the chance to show. Would you like to hear several Japanese speakers pronounce the term? Click here.

Teachers and Students use Pecha Kucha

Pecha kucha is well-suited for the age of the Common Core and other rigorous standards.  The Common Core calls for students to evaluate information from diverse sources, present information in an appropriate style, and make strategic use of digital media. Further, the pecha kucha style requires student presenters to be concise and choose their words and images wisely and well. Students might present pecha kucha via webcast or video (think, YouTube or Vimeo) so that parents and other community members can participate. They may work in small groups around selected topics. Who says every presentation has to be made to the entire class, anyway?

Teacher Educators and Teacher Candidates use Pecha Kucha

The IRA standards for Literacy Professionals call for teacher candidates to employ traditional print, digital, and online resources to “meet the needs of diverse students” and “prepare learners for literacy tasks of the 21st century.” Arguably positioned in one of the most influential roles with regard to the explosive possibilities of digital literacies in PK-12 education, teacher educators must continually model well-considered integration of digital tools in university classrooms. Within the context of a disciplinary literacy course, for instance, professors may choose the pecha kucha platform for in-class presentations in lieu of the tired Powerpoint® platform, especially in cases where visuals are preferable to print text, to effectively encapsulate and express important concepts, terms, or ideas. In this setting, pecha kucha presentations can be posted and revisited on Blackboard or similar course platforms for review. Professors may also invite undergraduate and graduate students to learn and employ pecha kucha to explore and represent basic literacy concepts with digital images and metaphors — and teach them to classmates. Teaching and/learning such “basic” literacy terms (e.g., phonemic awareness, syntax, semantics) through a multimodal digital platform (pecha kucha) may lead to enriched understandings of the ways in which reading involves the coordination of multiple systems including traditional “components” theory of teaching reading instruction as well as sociocultural theories of literacy acquisition.

How to Create Pecha Kucha: Resources and More

What are the steps to creating a pecha kucha presentation?

  • This website lists presentation steps in pecha kucha format and a template is available there, as well.
  • A few tips for beginners might be helpful to teachers who want to coach their students and minimize frustration.
  • Richard Edwards suggests that pecha kucha can be easily adapted to two-person teams; that is, a 20 slide X 20 second presentation by one student can become a 10 slide X 20 second presentation by two students. He also staggers presentations over class sessions such that no one class session is devoted to a long series of pecha kucha presentations, which, like traditional presentations, can be quite tiring for the audience.
  • Because pecha kucha is image intensive, it is very important that students learn the basic principles of Fair Use and apply them. This post from an earlier LiteracyBeat column may be a good start.  Learn more about Creative Commons and how it works to give students and other users the tools to share and use the creative work of others.

Similar to pecha kucha, Ignite presentations include 20 slides but they advance at the rate of 15 seconds each (total of five minutes). Some fairly good information about both ignite and pecha kucha are available from Trinity Valley Schools (opens as a PDF).

Assessing Pecha Kucha

Of course, any presentation in a classroom is an opportunity to learn and a chance to demonstrate what has been learned.  Assessment includes the possibility of feedback about content knowledge, processes leading to learning, and presentation, speaking, and listening proficiency appropriate to the grade level. Mr. Holliday designed this rubric as a means of assessing and providing feedback on the pecha kucha format. This university rubric from iRubric takes into account content knowledge  and this  one, by Danny, is designed with the junior high or middle school audience in mind. Educator Jeff Utecht suggests that participants rate the pecha kucha presentation using a form in Google Docs for quick analysis and feedback. Also on the blog post are additional ideas and a rationale for using pecha kucha.

Typical assessments measure and provide feedback as to how the presenter met the pecha kucha criteria (including 20 slides X 20 seconds each, 6 minutes 40 seconds total), concision, design, and cohesion, as well as content. Choo (2010) suggests that makers and composers of digital texts consider the following:

•           How do words function to “relay” or contribute to the meaning of an image?

•           Where will the image be placed in relation to the words and why?

•           How much of the frame-space will the image occupy, compared to the words?

•           Is the focal point of the text on the image or on its words, and why? (p. 172)

Here is one attempt at pecha kucha by DeVere recreated from the December 2013 presentation at Literacy Research Association. It is not quite perfect (you will notice it is longer than the allotted time!), I am sure you’ll agree, but do play the video and let us know what you see.

What have you done in your PK-12 or university classroom with pecha kucha?

*Presenters at the Literacy Research Association, Dallas, TX: Kelly Chandler-Olcott (Chair), Stergios Botzakis (Discussant), Sue Ringler Pet, Greg McVerry, Junko Yukota with William Teale, Joan A. Rhodes, Katina Zammit, William Ian O’Byrne, Thomas DeVere Wolsey

Guest posters:

W. Ian O’Byrne is an assistant professor of educational technologies at the University of New Haven. Read his blog post on the topic of pecha kucha here.

Sue Ringler-Pet works at Iona College, and you can read more about her here.

References:

Alvermann, D.E. (2002). Adolescents and literacies in a digital world. New York: Peter Lang.

Barab, S.A., & Kirshner, D. (2001). Guest editors’ introduction: Rethinking methodology in the learning sciences. The Journal of the Learning Sciences,10(1-2), 5-15.

Bolter, J.D. (1991). Writing space: The computer, hypertext, and the history of writing. Mahwah, NJ: Lawrence Erlbaum Associates.

Choo, S.S. (2010). Writing through visual acts of reading: Incorporating visual aesthetics in integrated writing and reading tasks. High School Journal, 93(4), 166-176.

Gee, J. (2005). Semiotic social spaces and affinity spaces. In D. Barton & K. Tusting (Eds.). Beyond communities of practice. Cambridge: Cambridge University Press.

Labbo, L. & Reinking, D. (1999). Negotiating the multiple realities of technology in literacy research and instruction. Reading Research Quarterly, 34(4), 478-492. doi:    10.1598/RRQ.34.4.5

Lankshear, C. and Knobel, M. (2006). New Literacies: Everyday Practices and Classroom Learning. 2nd ed. Maidenhead & New York: Open University Press.

The New London Group. (1996). A pedagogy of multiliteracies: Designing social futures. Harvard Educational Review, 66(1), 60–92.

Rose, D. H., & Meyer, A. (2002). Teaching every student in the digital age: Universal design for learning. Alexandria, VA: ASCD. Retrieved from http://www.cast.org/teachingeverystudent/ideas/tes/

Vocabulary Self-Collection Plus, Part 2

By Linda Smetana, Dana L. Grisham and Thomas DeVere Wolsey,

Last week, we introduced Vocabulary Self-Collection Plus (VSSPlus). Our goal in modifying this time-tested approach (Haggard, 1982) for the digital age (Grisham, Smetana, & Wolsey, in press) was to create an intersection where students might interact with each other in face-to-face spaces to add depth to their vocabulary and concept knowledge. At the same time, we wanted to use technology in a generative way (Grisham & Smetana, 2011) so that students became proficient users of technology while learning academic vocabulary related to their science lesson. This week, want to introduce the technologies we used, and share some lessons learned.

We chose two presentation methods, PowerPoint® and Thinglink, for the students’ e-dictionary entries.  However, many other tools are possible options.  Students might use Voicethread, Prezi, or Popplet, for example. In our work with these fifth-graders, we chose to limit the tools to one that is more familiar to them, and one that would be new.  Embedded in the technology task, we also helped students create audio recordings and showed them how to further deepen their word learning using the Wordsift website.

Wordsift

In Wordsift, students type in a word and produce a visual that links synonyms and related words. For example, “melting point” is a science term students in fifth-grade might be expected to know. By entering “melt” into the Wordsift visual thesaurus, students see related terms including Latinate versions and synonyms.  Please see figure 1.  In addition, Wordsift has many other capabilities including creating a word cloud, executing an image search, or sorting words according to academic word lists. Students in our exploratory group did not have access to screen capture tools, but a few used drawing tools to recreate the visual thesaurus they created in Wordsift.

Figure 1: Wordsift Result for “Melt”

Wordsift-melt

Wordsift

PowerPoint

While PowerPoint is a familiar tool to many, some features are not widely known.  We recently asked a group of teacher candidates if they knew PowerPoint could support narration they created, and only two responded that they knew of this feature. In our work with fifth-graders, the students use voice recorders to create the audio, and then they attached those to the PowerPoint slide.  We found that saving the slide as a PowerPoint show (rather than a regular PowerPoint) kept all the audio intact and could be used on any computer using free PowerPoint Show software if the regular version of PowerPoint was not available. Many of the students in the class started out exploring Thinglink, but because they were more comfortable with PowerPoint and recognized the time constraints of the task, switched to that format.

Learn more about adding audio narration to PowerPoint by clicking here.

Thinglink

The Thinglink tool intrigued students, but it required some playing around as they tried to figure out how best to use the tool. In PowerPoint, students could add text and images in any order, but in Thinglink, they needed to locate an appropriate image first.  Then, they could use the editing tools to tag the image with the text such as their definitions and rationales.  Find out more about Thinglink and view some examples by clicking here. An additional challenge was to upload the audio portion of the VSSPlus presentations to a podcast sharing site (we used Podbean), then link the podcast to the Thinglink.  To save time and avoid student frustration, we did this for the students.  For this reason, it was very important that students included their group names on the Thinglink as well as in their audio narration making it possible to easily match up the files.  Figure 2 is an embedded Thinglink created by students you can try.

Figure 2: Thinglink: Boiling Point (Click the image to view the interactive Thinglink)

The E-dictionary

We used Wikispaces to create the first page of the e-dictionary which you can see in figure 3 below. Additional pages for future learning can be added easily.  Students and parents can view the work at will, and learn from each other’s presentations. Other wiki tools, blogs, or even a learning management system (Canvas, BlackBoard, etc.) might be used to host the e-dictionary.

Figure 3: E-dictionary on Wikispaces

edictionary

E-Dictionary

Moving Forward

The first time out took a little over three hours because students had to learn to use certain aspects of the technology (inserting images, finding images, creating audio files, and so on). However, in the future, they will not have this hurdle, and the task will proceed much more rapidly.  The important aspect of this task is that students had to discuss the terms amongst themselves, evaluate the relevant aspects of images they chose together, plan their audio components, and work as a team to assemble the final product. Throughout the process, they became deeply aware of the relevant attributes of the concept represented by the term and also what it was not, in some cases.

For future VSSPlus projects, we would appoint a Wikispaces librarian whose job is to put the final presentations in the e-dictionary.  Some students were more adept at using the audio recording tools, and would become the audio engineers.  Thinglink aficionados are appointed the go-to person for Thinglink questions, and PowerPoint specialists who know how to link or insert audio, use the drawing tools, and save in PowerPoint Show format would have a place to shine. Finally, a means of sharing the work is needed.  A data projector with each group presenting their work to the class is a good start. If the classroom has a few computers or laptops, students could rotate through stations viewing and listening to the presentations at some stations while doing other academic work at different stations.

We hope you will try VSSPlus. Let us know what ideas you have to change it up and how well your students learned from the experience.

References

Haggard, M. (1982) The vocabulary self-collection strategy: An active approach to word learning.  Journal of Reading, 26(3), pp. 203-207.

Grisham, D.L. & Smetana, L. (2011) Generative technology for teacher educators. Journal of Reading Education, 36, 3, 12-18.

Grisham, D. L., Smetana, L., & Wolsey, T.D. (in preparation).  Post-reading vocabulary development through VSSPlus. In T. Rasinski, R. Ferdig, & K. Pytash, (Eds.). Technology and reading [working title]. Bloomington, IN: Solution-Tree.

Vocabulary Self-Collection Strategy Plus (VSS+)

by Dana L. Grisham (with Thomas DeVere Wolsey and Linda Smetana)

The Need for Vocabulary Learning

The need for breadth and depth of vocabulary accelerates through the grades as students encounter more challenging academic texts in print and on the Internet (CCSS, 2010). Improving students’ vocabulary is critical if students are to develop advanced literacy levels required for success in school and beyond, in the world of higher education and the workplace (Biancarosa & Snow, 2006; Graves & Watts-Taffy, 2008; Lubliner & Grisham, 2012).

Research suggests that students with a well-developed vocabulary learn many more words indirectly through reading than from instruction (Cunningham & Stanovich, 2001). If wide reading promotes vocabulary development, then conversations about their reading with adults and peers also strengthen students’ word learning (Biemiller & Boote, 2006). The goal of effective vocabulary instruction is to promote a lively interest in words through student expression and participation in a learning community that enjoys playing with words, builds on individual interests as well as curriculum needs, and emphasizes self-efficacy in word learning (Beck, McKeown, & Kucan, 2008; Graves & Watts-Taffy, 2008). As we have noted in this blog, the impact of technology on vocabulary development also needs to be considered (Castek, Dalton & Grisham, 2012).  In other contexts, we have suggested that technology integration should be generative in the sense that learners should use technological tools to satisfy their curiosity and to generate creations for learning and for the demonstration of learning (Grisham & Smetana, 2011).

Vocabulary instruction may occur before reading (preteaching important vocabulary), during reading (teaching what emerges as needed), and after reading. Vocabulary Self-collection Strategy or VSS (Haggard, 1982), is an after reading strategy.

The Common Core (2010) requires that technology be integrated into instructional and independent learning sequences.  Research has shown that the use of technology and technology-based instruction enhances student learning. In the post-reading vocabulary assignment we explore here, teachers may use use several forms of technology to increase student interest in vocabulary and a variant of the VSS strategy to engage students in more robust vocabulary learning.

Vocabulary Self-collection Strategy Plus (VSS+) occurs after a selection has been read and is based on the principles of VSS (Haggard, 1982), a researched-based strategy that captures the essence of vocabulary learning:  multiple exposures to a word, multiple readings of a text, collaboration of students and teacher, oral discussions and presentations, selecting words that are important to know, writing a script and recording a podcast, Internet search for illustrations, and building semantic webs. Recently, two colleagues (Thomas DeVere Wolsey and Linda Smetana) and I worked in a fourth-grade classroom in a public school in Northern California, to teach the students how to make an online dictionary (e-dictionary) page using the VSS+ strategy. The three of us spent three hours with Mr. D’s 33 students, first in the classroom, then in the computer lab at their school.

VSS+ is a structure that becomes familiar to students so they can use it with more independence over time. It takes more time in the beginning as teachers and students get used to the technology, the time, and the process.  To teach VSS+ we wanted to use text with interesting or unknown words or text dense with academic language. Mr. D provided us with a passage from the Science textbook in use in his classroom. Mr. D pre-taught some of the vocabulary and students had already read and discussed the package when we arrived.

Collaboration and peer learning are essential to the VSS+ strategy. Mr. D had the students divided into cooperative groups of 4 students. In order to differentiate instruction to meet the learning needs of students, they may be grouped heterogeneously or homogeneously as needed. Mr. D’s students were grouped heterogeneously.

To teach the VSS+ strategy, we began in the classroom with a PowerPoint slide and a demonstration of the strategy.  Using a think aloud protocol, I modeled the strategy by presenting a nominated word to the class, and provided suggested answers to the following questions. In the demonstration, we used an example that we constructed on “continent” (see below). These are the three elements that students must consider as they nominate a word.

a.     Where is the word found in the text?  (Page number; read the sentence aloud)

b.     What do the team members think the word means?

c.     Why did the team think the class should learn the word?  The team must tell the class why the word is important enough to single out for emphasis (a rationale).

During the team presentations of nominated words, we facilitated discussion, listened to students’ projected meanings of the word, and invited class members to contribute additional clarifications of the words. A chosen target word was allocated to each team to prepare an e-dictionary page.

 Then came the fun part!  We adjourned to the computer lab where we asked students in Mr. D’s class to use two formats for their e-dictionary pages:  PowerPoint (like our example below) and a program called Thinglink.

In the lab, under teacher supervision, team members used the Internet to locate images and or definitions for the target word and then collaboratively determined which of the images/definitions best fit their prediction of the word meaning.

We proposed the following formatting for the eDictionary:

Word and Written Definition

Image selection from the Internet, Photos, Illustrations or Student Drawings (if a scanner is available)

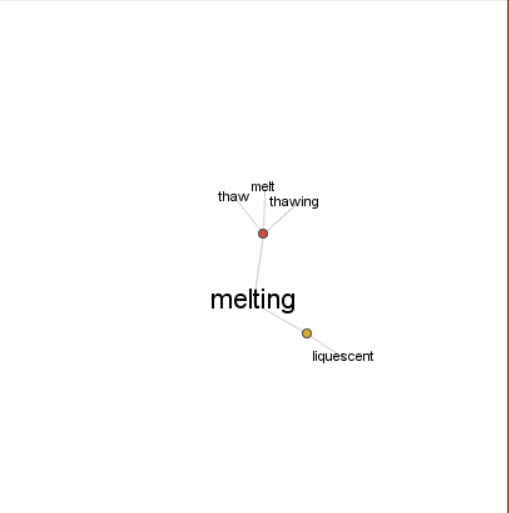
Semantic web (we used WordSift)

Student audio recording about the word (critical thinking about own word learning)

Arrangement of the PowerPoint or Website page

Audio recording by students of the main elements of the word exploration

Posting to website (classroom e-Dictionary)

In the following example, the three of us used PowerPoint to make a sample e-dictionary page using the word “continent.” In the PowerPoint page is an audio recording that cannot be loaded into WordPress. To hear this recording, please visit

http://media60.podbean.com/pb/5d2ff0db75b8e90568ffd2295b4362b8/52693971/data1/blogs25/353339/uploads/ThinglinkContinents.mp3

Slide2

Next week in Literacy Beat, Linda, DeVere and I will talk more about the work we did with Mr. D’s students and share examples of their PowerPoint and Thinglink pages with you.

References

Biancarosa, C., & Snow, C. E. (2006). Reading next—A vision for action and research in middle and high school literacy: A report to Carnegie Corporation of New York (2nd ed.). Washington, DC: Alliance for Excellent Education.

Biemiller, A. & Boote, C. (2006). An effective method for building meaning vocabulary in primary grades. Journal of Educational Psychology, 98, 44-62.

Blachowicz, C. L. Z., & Fisher, P. (2000). Vocabulary instruction. In R. Barr, P.

Mosenthal, P. S. Pearson, & M. Kamil (Eds.), Handbook of Reading Research, vol. III, (pp. 503-523). White Plains: Longman.

Castek, J., Dalton, B. & Grisham, D. L. (2012). Using Multimedia to Support Generative Vocabulary Learning. In J. F. Baumann & E. J. Kame’enui (Eds.). Vocabulary Instruction: Research to Practice (2nd Edition). New York: Guilford.

Common Core State Standards Initiative. (2010). Common Core State Standards for English Language Arts & Literacy in History/Social Studies, Science, and Technical Subjects. Washington, DC: CCSSO & National Governors Association.

Cunningham, A.E. & Stanovich, K. E. (2001).  What reading does for the mind. American Educator, 22, 1/2, 8-15.

Graves, M.E. & Watts-Taffy, S. (2008).  For the love of words:  Fostering word consciousness in young readers. Reading Teacher, 62, 99.185-193.

Haggard, M. (1982) The vocabulary self collection strategy: An active approach to word learning.  Journal of Reading, Vol. 26, No. 3 (Dec., 1982), pp. 203-207.

Grisham, D.L. & Smetana, L. (2011) Generative technology for teacher educators. Journal of Reading Education, 36, 3, 12-18.

Lubliner, S. & Grisham, D. L. (2012). Cognate Strategy Instruction: Providing Powerful Literacy Tools to Spanish-Speaking Students. In J. Fingon & S. Ulanov (Eds.), Learning from Culturally and Linguistically Diverse Classrooms: Promoting Success for All Students (pp. 105-123). New York: Teachers College Press.


1

Lesson Planning as Collaboration in Digital Environments

Thanks to Susan Toma-Berge for this guest post on LiteracyBeat this week.  Susan is Coordinator of the Multiple Subjects Program at the University of California, Irvine. ~DeVere

Collaborating with colleagues and students is almost effortless since I started using Google Apps with my students, primarily Google Drive.  Recently, our campus adopted Google Apps for Education, which gave us the option of merging our existing campus email with Gmail.  I thought that alone was pretty harmless and uneventful, until I started exploring the possibilities.  Now my ability, and that of the teacher candidates with whom I work, to collaborate on documents, gather information, and archive information has increased and the process is much more streamlined.

Class Discussion

When I first learned of Google Drive a few years ago, I knew only of Google Docs.  Our campus email was not integrated with Google at the time so I had two separate email accounts – my campus email and my Gmail.  I used my personal Gmail account and utilized Google Docs as a way to archive important documents (like drafts of my dissertation).  I attempted multiple times to use Google Docs in my teaching by writing out discussion questions for students to answer in small groups during class.  I was able to do this by creating a Google Doc, then share it though the link provided when I added other viewers who could edit.  I then either emailed the link to my class, or added it to my class website.  The goal was to be able to have all my students work on different questions then have the ability to project the whole document to the class for our whole group discussion.  It was meant to replace using chart paper and markers that were a staple of our group discussion and sharing.  The students would then have notes from each of the other small groups who worked on different questions, and all these notes were saved on my course website for the remainder of class.

Without fail, I had students who could not access the document for one reason or another.  Some had difficulty if they did not have a Gmail account.  Others simply could not see the text on their own laptops.

Collaborating

In the not so recent past, asking my students, all pre-service teachers, to collaborate on a document meant sitting down together hunched over the same computer screen with one typing.  This style of collaborating had benefits, because they were able to share ideas and instantly put them in words.  The downside was finding a time for both of them to work together to devote to this task.

If they could not meet in person, the task meant working independently at their own computers then merging text together once they shared their writing through email or with a flash drive.  This was effective because each could each compose on their own time and share when done.  The downside to this method was limited face to face collaboration and the writing was frequently disjointed because they usually divided the task into parts.  This type of collaboration also made it difficult to keep track of the most current version of the document, especially if multiple revisions were emailed back and forth.

Now that all my students’ campus emails are linked with Gmail, they all have Google accounts so they have many more options for collaborating.  They meet face-to-face during class time, but work on group assignments using Google Docs.  When working on a lesson plan together, my student teachers have reported sitting at their own computers at home while writing up a shared lesson plan.  They use the chat feature to discuss what ideas are included.  The collaboration is in real time and both student teachers have the most recent version of their document.

Pairs of student teachers used Google Docs for their weekly lesson plans, as well.  They maintained a shared document with the mentor teacher so everyone was aware of the week’s plans and any changes made.  The mentor teacher shared these plans with me so I was also able to monitor my pre-service teachers’ weekly progress. Each lesson evolved, collaboratively, over time and in the cloud. See figure one, below, for an example of the final product.

final lesson plan

Figure 1: Final Collaborative Lesson Plan Contributed by Jasmine Hwang and Tawnee Houses

The unit plan (figure 2, below) was created by a mentor teacher, Johnnie Perry, when he had two student teachers in his classroom. They used the Google doc to keep updated versions of their weekly plans available to all three of them.

figure 2

Figure 2: Shared Unit Plan by Johnnie Perry, master teacher, and two student teachers

Collaborative Research

I also teach a class in the masters of art in teaching (MAT) program where my students are required work in a small group to write an action research proposal.  The majority of my students wrote their group papers using Google Docs.  Even though they met face-to-face twice a week in class, group members had to open their own computers as they discussed the themes of their literature review or selected instruments for data collection.  During this conversation, one or more members of the group put these ideas in writing during this collaboration. As an instructor, it was gratifying to hear these rich conversations and see their projects develop as multiple colored dots, representing each author’s cursor, floated across the screen.  This type of collaboration ensured all students in the group had the same version, even if one member was away that day.  These students also mentioned using Google Hangouts to discuss their writing when they composed from home.

Potential

I’m positive that we have just scratched the surface on how using a cloud-based shared document, like Google Docs, can aid collaboration and writing, especially for student and novice teachers.  The potential for teachers to share ideas and put them down on “e-paper” is unlimited – even at brick-and-mortar institutions like mine, where most of the classes are “on-the-ground.”  How do you facilitate collaboration for your student teachers and teachers in training?


Copyright and Fair Use in the Classroom: An Introduction

By Thomas DeVere Wolsey

Working with multimedia, almost invariably, means incorporating the works of others into a presentation (see Huffman, 2010). Teachers and students do have some latitude, called Fair Use. However, it is always an effective practice to make sure that others’ intellectual properties are attributed or cited in any presentation. While there can be substantial penalties for infringing on the works created by others, the most important point, arguably, is that attributing the works of others is simply good citizenship. Creators want credit for their work, and any user is a potential creator, as well. In digital environments, creators, authors, and users take care of one another by properly attributing the sources they use. Though teachers, professors, and students are very familiar with citation of text-based sources (e.g. APA, MLA, Chicago style), these style guides often do not provide sufficient guidance when a student, for example, wants to incorporate images, audio, or video created by others in a multimedia presentation.

In this video, some general ideas related to citing video, audio, and image sources are explored, especially as they relate to presentations (using PowerPoint, Prezi, and similar formats).


An excellent place to begin learning about digital citizenship is the MediaLab at the University of Rhode Island. Teacher and student resources can be found on the Medialab website.

Though not exhaustive, these websites provide a place to begin looking for music and image sources that students and teacher might use in their own multimedia presentations while considering the rights of others who have contributed their works.

WikiMedia Commons
Creative Commons Search Tool and Creative Commons Licenses
National Gallery of Art – Open AccessJamendo
Low cost images: Dreamstime

Added March 13, 2014: Teach Students About Creative Commons: 15+ Resources – See more at: http://www.techlearning.com/Default.aspx?tabid=67&entryid=7298#sthash.vLSuk9fQ.dpuf

Explore more resources at these Delicious.com links:

Fair Use
Copyright
Plagiarism

I hope that this brief introduction leads you and your students toward the goal of better digital citizenship through attribution and citation of the intellectual property others create—a springboard to more ideas and a collaborative world.

Questions for Students and Teachers:

1. Consider the last multimedia presentation you placed online. How did you cite or otherwise attribute the digital images, audio files, or other media you incorporated?
2. How might you have more effectively cited the sources as a digital citizen to show how your own ideas built upon the ideas and creative works of others?
3. In what ways do traditional styleguides help you cite works you used? How do traditional styleguides fail to address multimedia presentations and use of images, audio, or video files in your own creative works?

References:
Huffman, S. (2010, May/June). The missing link: The lack of citations and copyright notices in multimedia presentations. TechTrends, 54(3), pp. 38-44.

Links to Traditional Styleguides:
APA
MLA
Chicago
Turabian

Creative Commons License
Copyright and Fair Use in the Classroom: An Introduction by Thomas DeVere Wolsey is licensed under a Creative Commons Attribution-NoDerivatives 4.0 International License.
Permissions beyond the scope of this license may be available at https://literacybeat.com/about/.

Web-Watch: The Balanced Literacy Diet

By Thomas DeVere Wolsey

This week, I share a website I recently discovered while visiting with a colleague from the University of Toronto. The Balanced Literacy Diet website takes an innovative approach to supporting teachers, parents, administrators, and teacher-educators in preventing literacy failure. The Balanced Literacy Diet approach uses a familiar metaphor to address the complex nature of teaching literacy: the food pyramid. On this site, the food pyramid is transformed into a reading pyramid and a writing pyramid. Fifteen essential “food” groups form the foundation of the literacy diet.

Reading Pyramid

Literacy Diet Reading Pyramid

The food groups include topics such as motivation to read, writing processes, and text structures, for example. View a full list by clicking here. Teachers can then use the recipe finder to locate activities and explanations built on the food groups. For example, one recipe for fourth grade addresses the food group, “Real Writing: Text Structures” through a math lesson (see figure 2, below). The recipe includes an activity objective, four images of student work products, a video with a teacher explaining the recipe, and a transcript of the video. Links to other recipes by the featured teacher are included. Each video is concise and just long enough to keep the viewer engaged. The math literacy lesson video is just one minute, twenty-three seconds in length.

math & literacy

Math and Literacy Recipe

Another innovative feature of the site is the virtual classroom tour option. The virtual classroom tours are interactive; that is, the viewer controls what to look at in the classroom and can point to features which then pop-up a description and additional video describing what is on the screen. I recommend using Chrome or Firefox rather than Internet Explorer at this time; Internet Explorer 10 appears to limit what you can do on the website.

The Literacy Diet website is a project of the Melissa Institute for Violence Prevention and Treatment. A key tool in the Institute’s arsenal rests on the idea that improved literacy for students translates to a more peaceful and less violent society overall. Please take a moment to read about the Institute. The Ontario Institute for Studies in Education at the University of Toronto hosts the site. You may want to grab a soda and snack before you visit the Literacy Diet site—once you start reading, viewing, and touring the recipes for literacy success, you may spend more time than you planned getting to know the innovative teachers on this interactive and useful site. Teacher educators will find all kinds of useful examples for the teachers-to-be-with whom they work. Excellent ideas gathered by grade/age, stage of literacy development, and food group will inspire new ideas for teachers, parents, and administrators.

The Info on Infographics: Synthesizing Multiple Sources with Text and Visuals

By Thomas DeVere Wolsey
Infographics may be a term you haven’t heard (or if you have heard of it, you may have thought, “Ugh, another infomercial”). However, even if you haven’t heard the term, it is very likely you have seen an infographic if you have been on Facebook, YouTube, or on your school or company website. What they are is as intriguing as the first picture book (it was Orbis Pictus, by the way) or the comic books and graphic novels you read when you were a kid, or last week, for that matter. As important, infographics are tools that teachers can use to help students understand big ideas, and they are tools that students can use to synthesize multiple sources of information.
What is an infographic? Well, it combines data, charts and tables, text, maps, and images in a persuasive and engaging way. Infographics are often fun to read. They transcend the individual chart or table by bringing together many types of information. Here is one example:

Infographics

Infographic of Infographics

and here is another

The topics captured by infographics are diverse. They can convey complex economic concepts, or persuade the reader to take action to help solve a complicated problem facing the world. They may present an array of terms that develop conceptual understanding of vocabulary. For students, infographics gather information and present it in an interesting and coherent way. At the same time, the best infographics challenge the imagination and the intellect. Quite often, infographics have a very professional look about them, but, get this: students (and their teachers) can create them, too. I decided to test one infographic creation tool just to show readers of LiteracyBeat that it can be done. If I can do it, so can you. I used Picktochart for this experiment to render LiteracyBeat as an infographic. LitBeat-Infographic

Click the image to see the infographic in greater detail.

How might readers of LiteracyBeat use infographics to help their students make sense of content? When students create infographics, they might
• Compare two or more works of literary fiction or the authors of those works +
• Use images, text, and tables to show how social media affects their own lives
• Present local findings and those of peers at another school in a different geographic region with comparisons of international data
• Encourage peers to read, via an infographic on the school webpage, by including data about the most popular books read, the most assigned books, and so on.

How have you used infographics? How might you plan to use infographics to assist your students with summarization, synthesis, and other high-level cognitive tasks?

Resources:
From Kathy Schrock: http://www.schrockguide.net/infographics-workshop.html
Plus a rubric: http://www.schrockguide.net/uploads/3/9/2/2/392267/infographic_rubric.pdf
From Visual.ly: http://create.visual.ly/
List of tools and links From InfographicsArchive: http://www.infographicsarchive.com/create-infographics-and-data-visualization/
More resources on Delicious: https://delicious.com/tdwolsey/Infographics